Distributed Tracing
Performance issues, errors, and exceptions are unfortunate events that may occur in a production environment. In order to identify such an event, observing the production environment is essential. APK provides the ability to observe how the requests are handled via an OpenTelemetry based distributed tracing implementation. By connecting APK to one of the supported distributed tracing systems, users are able to easily debug and identify production issues.
Supported distributed tracing systems,
- Jaeger
- Zipkin
- Azure Application Insights
- OTLP gRPC supported telemetry backends
Configure Distributed Tracing
To set up distributed tracing, start by following the instructions outlined in Customize Configurations. These instructions will guide you through the process of acquiring the values.yaml file, which you will then use to tailor the tracing configurations to your specific needs.
Note
If you are trying out tracing capabilities of APK and do not have an actual deployment of Jaeger or Zipkin, you can start APK together with Jaeger/Zipkin by applying the below kubernetes artifacts to your cluster.
apiVersion: apps/v1
kind: Deployment
metadata:
  name: jaeger
spec:
  selector:
    matchLabels:
      app: jaeger
  replicas: 1
  template:
    metadata:
      labels:
        app: jaeger
    spec:
      containers:
        - name: jaeger
          image: jaegertracing/all-in-one:latest
          imagePullPolicy: IfNotPresent
          ports:
            - containerPort: 16686
            - containerPort: 9411
            - containerPort: 4317
          env:
            - name: COLLECTOR_ZIPKIN_HOST_PORT
              value: "9411"
            - name: COLLECTOR_OTLP_ENABLED
              value: "true"
          resources:
            limits:
              cpu: "0.5"
              memory: "512Mi"
            requests:
              cpu: "0.2"
              memory: "256Mi"
---
apiVersion: v1
kind: Service
metadata:
  name: jaeger
spec:
  ports:
    - name: http
      protocol: TCP
      port: 16686
      targetPort: 16686
    - name: collector
      protocol: TCP
      port: 9411
      targetPort: 9411
    - name: otlp
      protocol: TCP
      port: 4317
      targetPort: 4317
  selector:
    app: jaeger
---
apiVersion: networking.k8s.io/v1
kind: Ingress
metadata:
  name: jaeger
spec:
  rules:
    - host: jaeger.example.com
      http:
        paths:
          - path: /api/v2/spans
            pathType: Prefix
            backend:
              service:
                name: jaeger
                port:
                  name: collector
          - path: /
            pathType: Prefix
            backend:
              service:
                name: jaeger
                port:
                  name: http
apiVersion: apps/v1
kind: Deployment
metadata:
  name: zipkin
spec:
  replicas: 1
  selector:
    matchLabels:
      app: zipkin
  template:
    metadata:
      labels:
        app: zipkin
    spec:
      containers:
        - name: zipkin
          image: openzipkin/zipkin
          imagePullPolicy: IfNotPresent
          ports:
            - containerPort: 9411
          resources:
            limits:
              cpu: "0.5"
              memory: "512Mi"
            requests:
              cpu: "0.2"
              memory: "256Mi"
---
apiVersion: v1
kind: Service
metadata:
  name: zipkin
spec:
  selector:
    app: zipkin
  ports:
    - protocol: TCP
      port: 9411
      targetPort: 9411
---
apiVersion: networking.k8s.io/v1
kind: Ingress
metadata:
  name: zipkin-ingress
spec:
  rules:
    - host: zipkin.example.com
      http:
        paths:
          - path: /
            pathType: Prefix
            backend:
              service:
                name: zipkin
                port:
                  number: 9411
Get your cluster IP and map that to either jaeger.example.com or zipkin.example.com in your /etc/hosts file.
Jaeger
When using Jaeger for tracing, the format is same as for Zipkin to publish spans from APK. Therefore, the tracer type is configured as zipkin. Follow these steps to configure APK with Jaeger.
-
Update the
values.yaml'swso2.apk.dp.gatewayRuntimesection with the following values:tracing: enabled: true type: "zipkin" configProperties: host: "jaeger" port: "9411" endpoint: "/api/v2/spans" instrumentationName: "APK" maximumTracesPerSecond: "2" maxPathLength: "256" -
Follow the quick start guide and invoke backend.
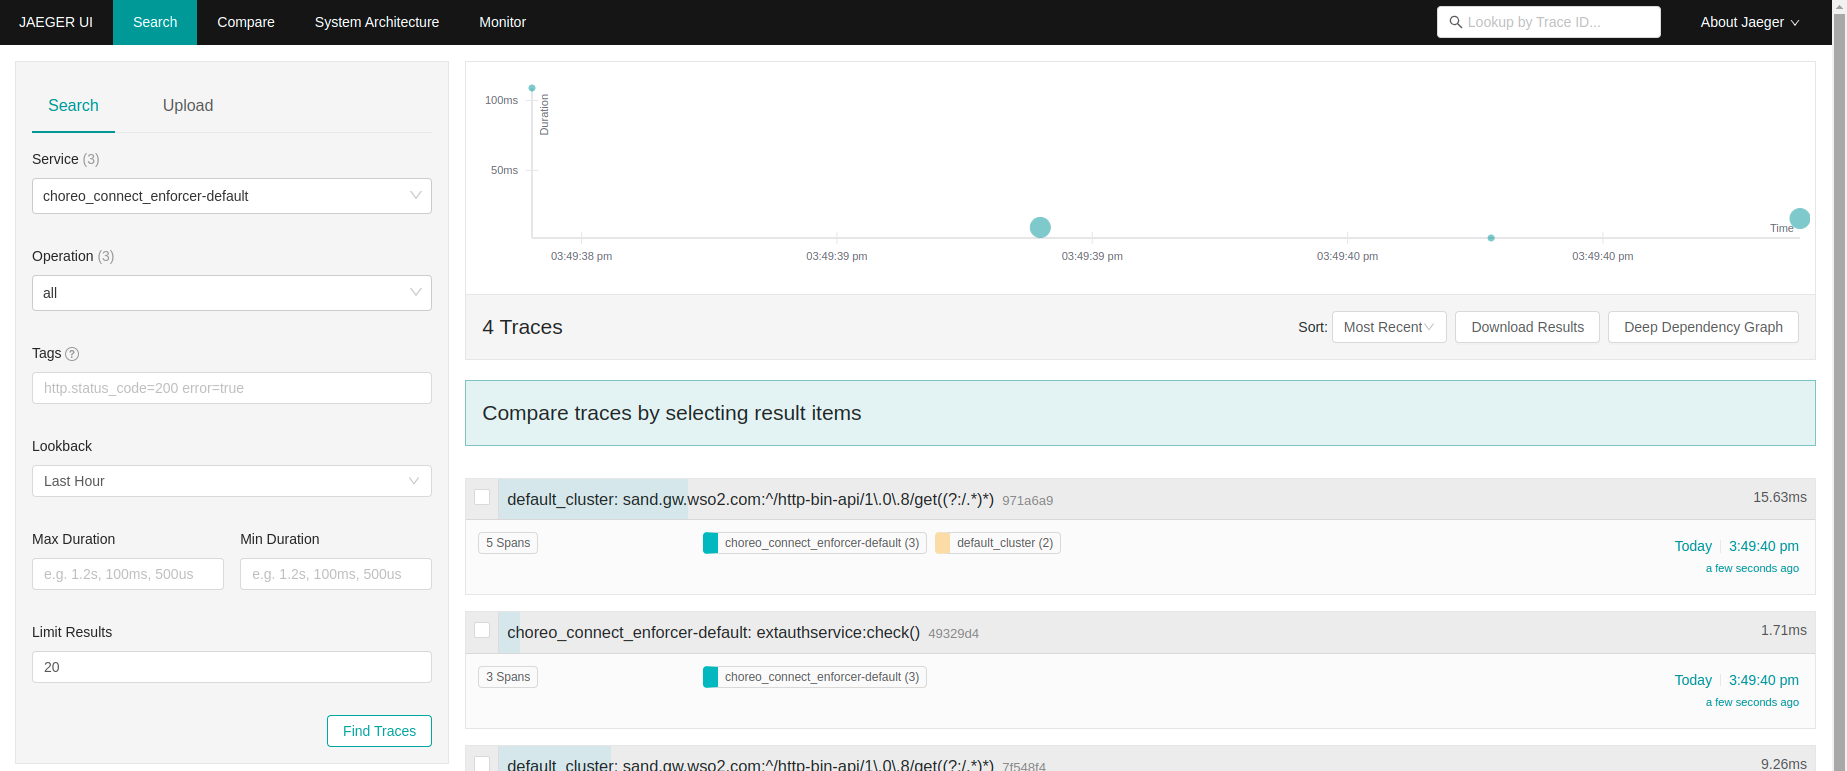
- Open Jaeger UI to view the traces. Navigate to http://jaeger.example.com
You will be able to browse through the request traces and expand each trace to view complete trace details.
Zipkin
Follow these steps to configure WSO2 APK with Zipkin.
-
Update the
values.yaml'swso2.apk.dp.gatewayRuntimesection with the following valuestracing: enabled: true type: "zipkin" configProperties: host: "jaeger" port: "9411" endpoint: "/api/v2/spans" instrumentationName: "APK" maximumTracesPerSecond: "2" maxPathLength: "256" -
Follow the quick start guide and invoke backend.
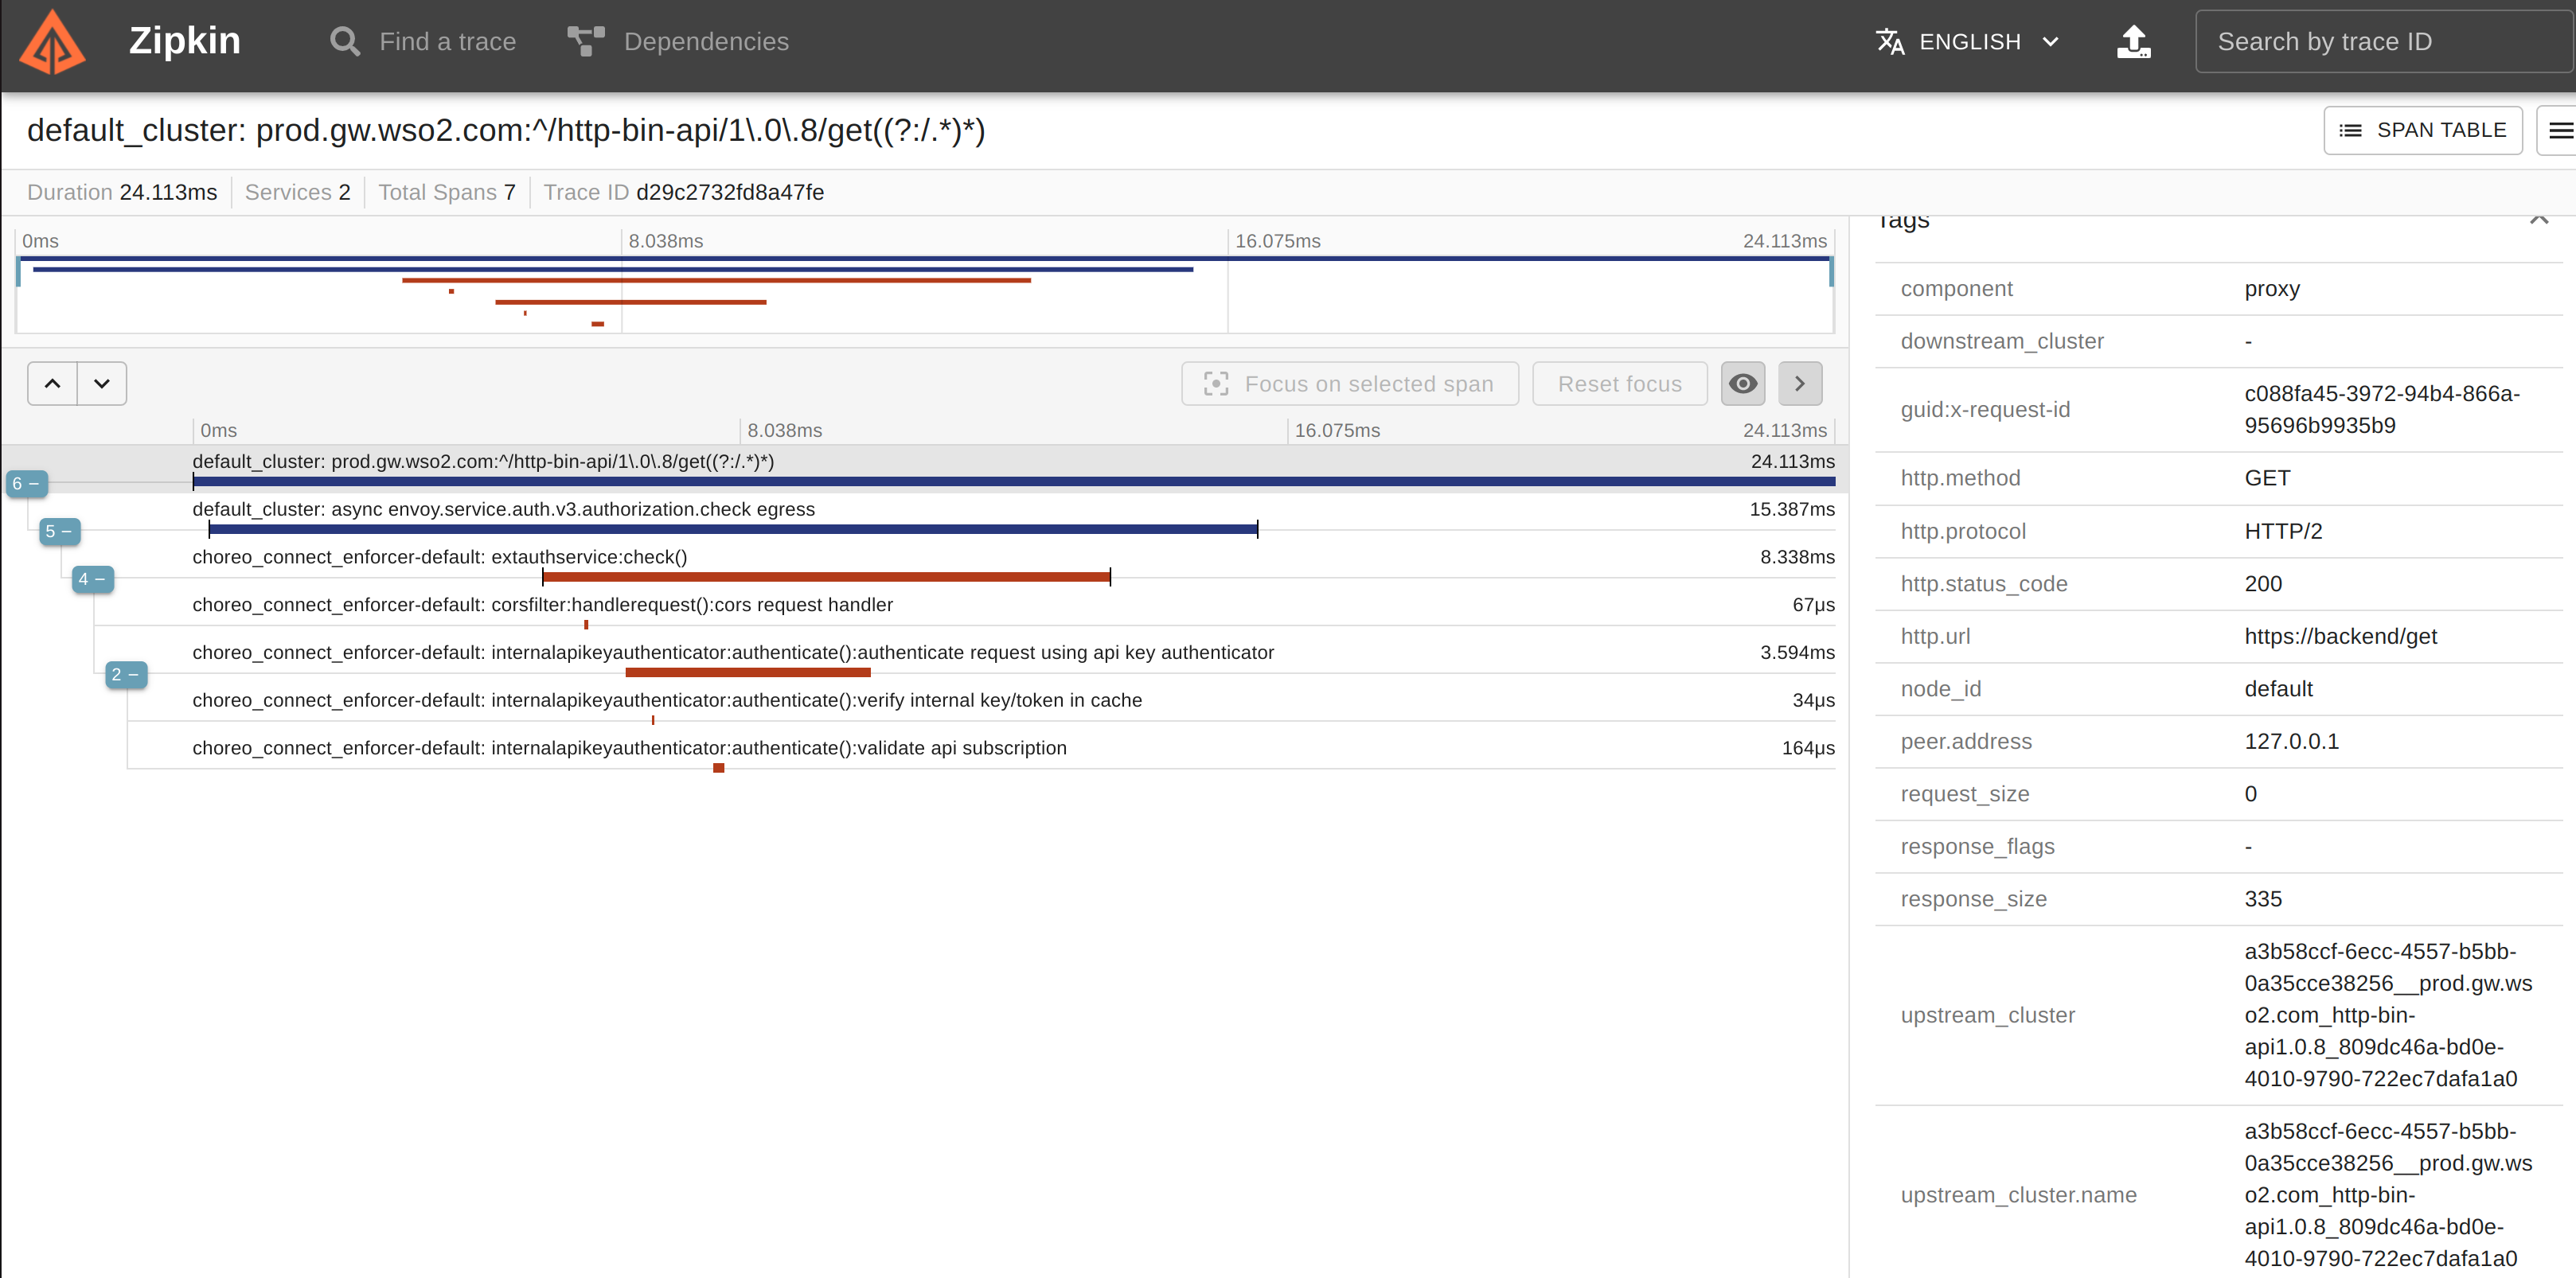
- Invoke the newly create API and open Zipkin UI to view the traces. Navigate to http://zipkin.example.com
- Filter traces by
tagQuery=otel.library.name=APKquery.
You will be able to see all traces. Detailed trace view will look like below.
Azure Application Insights
Follow these steps to configure WSO2 APK with Azure Application Insights.
-
First you need to obtain the
ConnectionStringfrom the Azure portal.- Log in to the Azure portal.
- Copy the
Connection Stringfrom the overview page ofApplication Insightsresource. E.g.,InstrumentationKey=ab71943f-xxxx-xxxx-xxxx-fb2eb69ae11d;IngestionEndpoint=https://region.applicationinsights.azure.com/
-
Add the following configuration to
values.yaml'swso2.apk.dp.gatewayRuntimesection.tracing: enabled: true type: "azure" configProperties: connectionString: {APPLICATIONINSIGHTS_CONNECTION_STRING} instrumentationName: "APK" maximumTracesPerSecond: "2"tracing: enabled: true type: "azure" configProperties: connectionString: "InstrumentationKey=ab71943f-xxxx-xxxx-xxxx-fb2eb69ae11d;IngestionEndpoint=https://xxxxxx.applicationinsights.azure.com/" instrumentationName: "APK" maximumTracesPerSecond: "2" -
Follow the quick start guide and invoke backend.
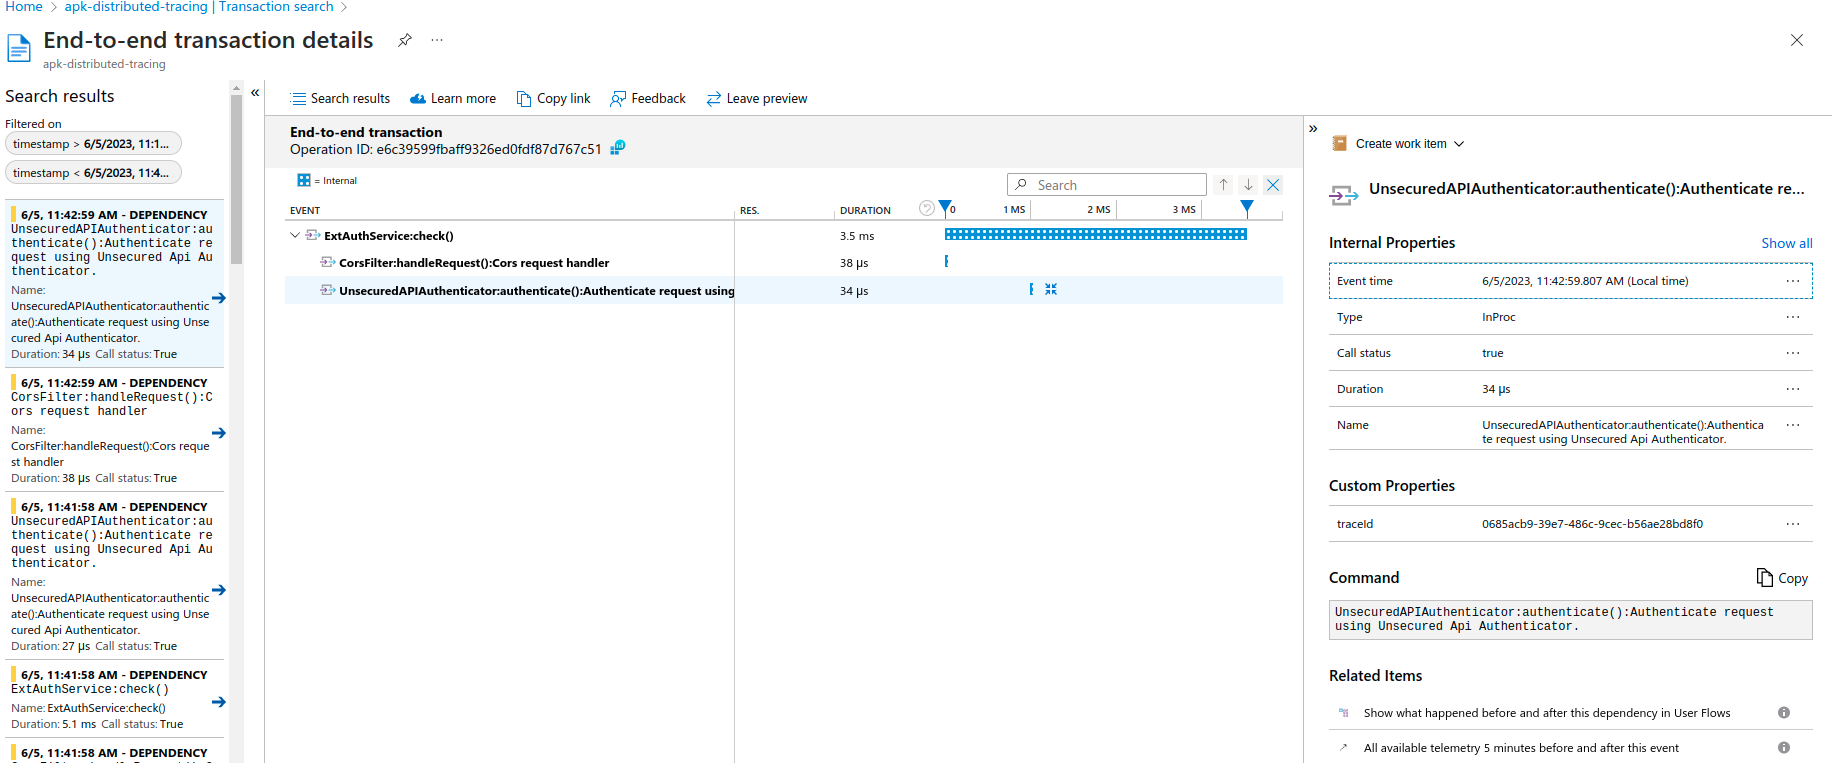
- Now open "Azure Application Insights" Trasaction search window and select
DependencyforEvent typesfilter
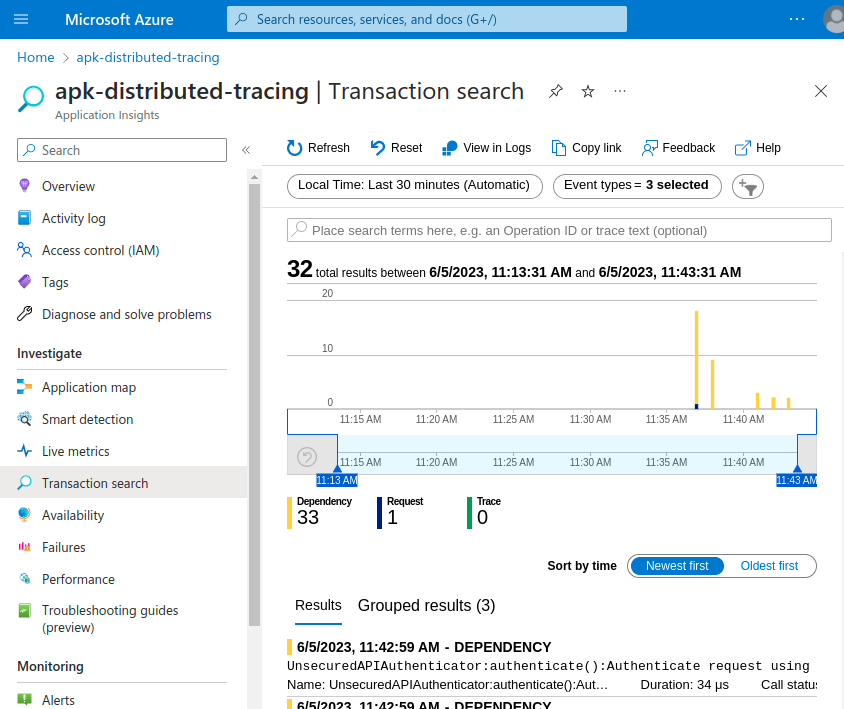
You will be able to see all traces. Detailed trace view will look like below.
OpenTelemetry protocol (OTLP)
OTLP is a vendor agnostic protocol defined as a part of OpenTelemetry project to publish telemetry data to any telemetry backend that supports OTLP. Most of the open source and commercial telemetry backends have native OTLP support or provide OTLP support in the form of a separate distribution. Refer the OpenTelemetry vendor support documentation for more information.
Configure APK to publish OTLP traces to a Jaeger backend
-
The kubernetes artifacts you have applied at the beginning already contain the required configuration for APK to publish OTLP traces. Add the following configuration to
values.yaml'swso2.apk.dp.gatewayRuntimesection.tracing: enabled: true type: "otlp" configProperties: host: "jaeger" port: "4317" endpoint: "/api/v2/spans" instrumentationName: "APK" maximumTracesPerSecond: "2" maxPathLength: "256" connectionTimeout: "20" -
Follow the quick start guide and invoke backend.
- Open Jaeger UI to view the traces. Navigate to http://CLUSTER_IP:16686
You will be able to browse through the request traces and expand each trace to view complete trace details.
Configure APK to publish OTLP traces to New Relic OTLP gRPC collector
- Create an account in New Relic portal and generate a license key to publish traces. New Relic OTLP guide
- Add the following configuration to
values.yaml'swso2.apk.dp.gatewayRuntimesection
tracing:
  enabled: true
  type: "otlp"
  configProperties:
    connectionString: "https://otlp.nr-data.net"
    authHeaderName: "api-key"
    authHeaderValue: "<INGEST_LICENSE_KEY>"
    instrumentationName: "APK"
    maximumTracesPerSecond: "2"
    maxPathLength: "256"
    connectionTimeout: "20"
tracing:
  enabled: true
  type: "otlp"
  configProperties:
    connectionString: "https://otlp.nr-data.net"
    authHeaderName: "api-key"
    authHeaderValue: "e8f478ae6d3c97f845e16b6cfba0ea5e95e3NRAL"
    instrumentationName: "APK"
    maximumTracesPerSecond: "2"
    maxPathLength: "256"
    connectionTimeout: "20"
- Follow the quick start guide and invoke backend.
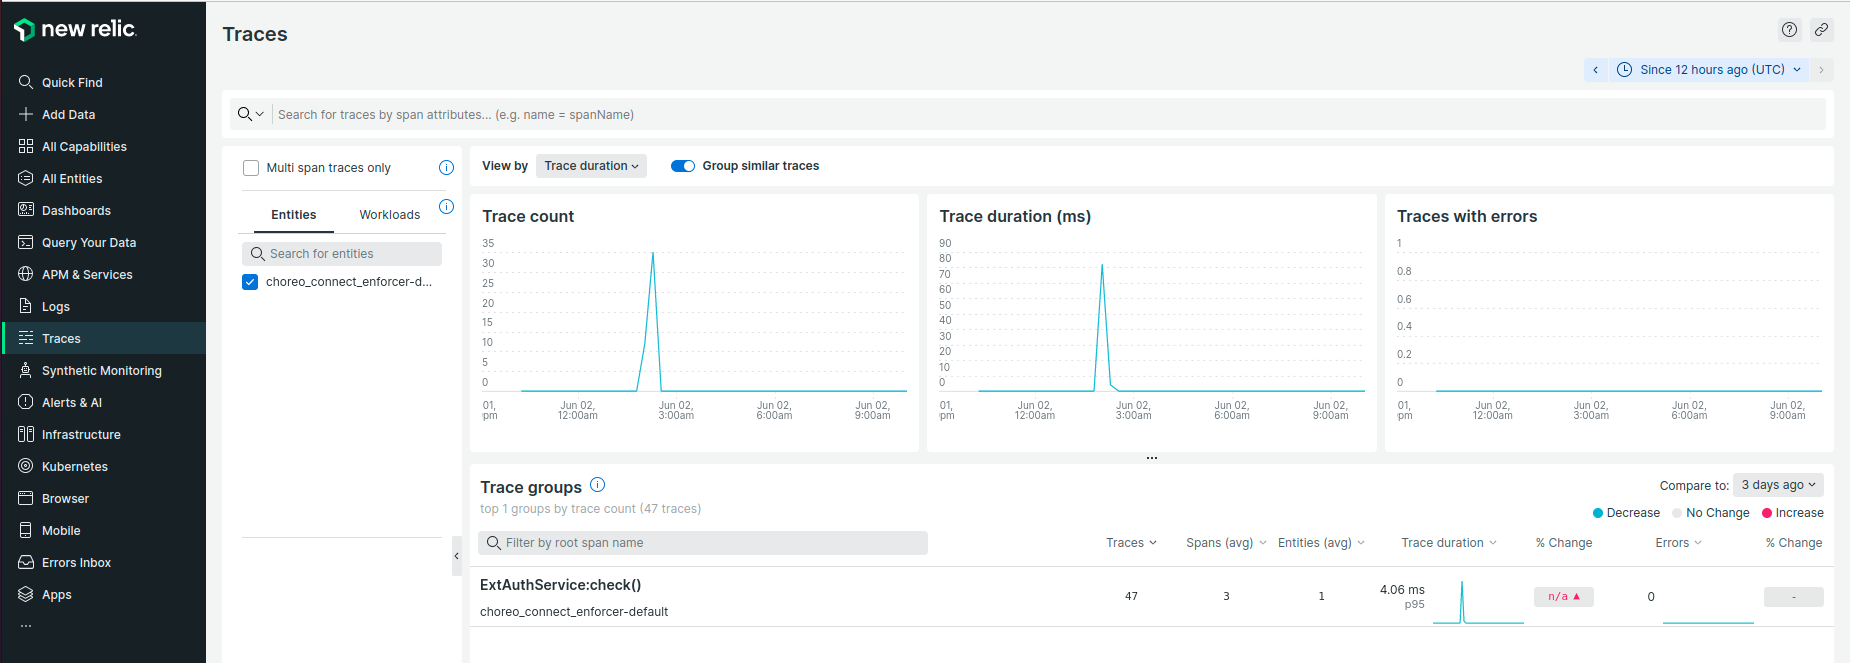
- Go to New Relic Tracing dashboard to view the traces.
You will be able to browse through the request traces and expand each trace to view complete trace details.
Note
Envoy's ratelimiter exclusively supports OTLP tracing. Thus its necessary to use OTLP tracing type to monitor rate limiter traces in the APK.
Info
Similarly any telemetry backend that supports OTLP gRPC telemetry data collection can be used by setting up related values for connectionString, authHeaderName and authHeaderValue.
